Using Pulp Python Package for Linear Programming
Most of us have been using Excel Solver Add-In for running linear programming-based optimizations in the course of our work (or research/studies). The capabilities of the Excel Solver are more than sufficient to meet majority of our analytical requirements but, it is interesting to see and observe the use of the Pulp package to run similar scenarios.
Key Observations
Positives
The time required to run the optimization problem in Pulp is far lesser as compared to the Excel solver
The number of decision variables is unlimited in Pulp as compared to the Excel Solver (limit of 200 for the free public version)
The use of the IDE environment allows the user to quickly identify the number of constraints, and decision variables at a quick glance instead of having to manually count the same in an excel file
The ability to build constraints through the use of for loops and dictionary objects in the Python setup can allow the user to avoid creating multiple tables in excel reducing the manual effort and data clutter in the excel file
Challenges
It is difficult to understand the outcome along with the final output variables as intuitively as Excel
The output of the model run needs to be converted into an easy-to-use Pandas Dataframe to be easily extracted and interpreted by an end-user
Conclusion
The overall exercise helped me see the benefits of the Pulp package in comparison to Excel. However, given that most use cases will not be breaching the available limit in Excel and there is a significant learning curve for plain excel users or amateur Python users to quickly view and extract the results for interpretation, the usage of the package in its raw form might not be beneficial to the operations analysts community as on date.
The availability of paid optimization solver versions being used by large companies also allows analysts to work on more complicated problems without the need to learn a new language rather, focusing on their business knowledge for value delivery.
Showcasing the use of Pulp for Linear Programming Optimization
The use case for this study was part of the Udemy course and was shared as an assignment for class participants.
Primary Objective and the Objective Function in Pulp
The primary goal of the assignment is to minimize the total cost of supply from plants to warehouses and subsequently to end customers (termed as shops). The scale of the problem can be defined as follows -
4 products
4 production plants
8 warehouses
18 shops (end customers)
The final outcome also needed to define which plants and warehouses needed to be utilized for meeting the demand in the most optimal manner.
Defining the overall cost function would require the calculation of the following costs -
Inbound Transportation Cost
Outbound Transportation Cost
Production Cost
Fixed Plant Operating Cost
Fixed Warehouse Operating Cost
Warehouse Handling Cost
The above costs would require the user to define multiple tables for plants and warehouses for capturing the product movement decision variables indicating movement quantity and open plants/warehouses
Developing the same solution in Pulp package becomes easy with the help of for loop and lpSum function helping to create multiple combinations of plant/warehouse/customer in a single line of code
Creating Decision Variables
Creating decision variables in excel would have required us to create at least 4 separate tables to map the product movement output and separate tables to map the plant-opening and closing for each individual product. These could either be separate tables or lengthy tables with higher number of table parameters.
The same mapping in Pulp is accomplished through 4 lines of code as shown below -
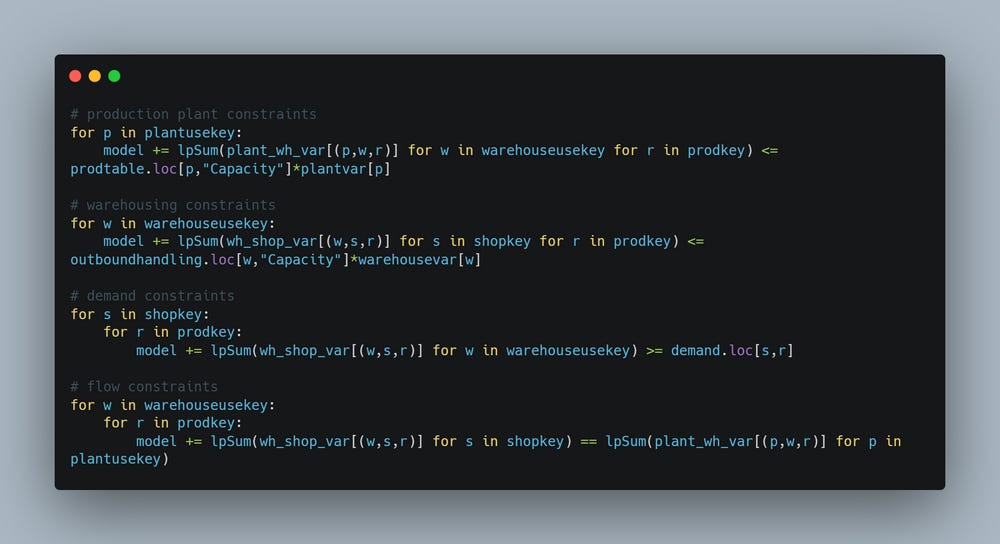
Creating the list of Constraints
The subsequent list of constraints can also be developed easily using a similar approach utilizing for loops to create a 2D matrix
Final Contours of the Problem
Total Number of Decision Variables - 704
Total Number of Constraints - 128
The total number of decision variables would have lead to challenges in executing this problem in Solver (free version). However, running the model and generating the results would subsequently require creation of a Pandas dataframe to subsequently interpret the final results. This can be a bit cumbersome of amateur users but, with a bit of effort, one can use this methodology and concepts as a backup, if needed.
Going through this exercise helped me appreciate the capabilities of the Python language and this can provide support to analysts in case of no access to the optimization tools which are definitely far more user-friendly but, come with a hefty price tag.


